|
Analysis of CIA Trajectory Study On March 17, 2005 I received a packet of data that the CIA released under the Freedom of Information Act as a result of a lawsuit by Ray Lahr. Following is an analysis of the CIA Trajectory Model. This model appears to have been created to support the CIA video showing the zoom climb. The
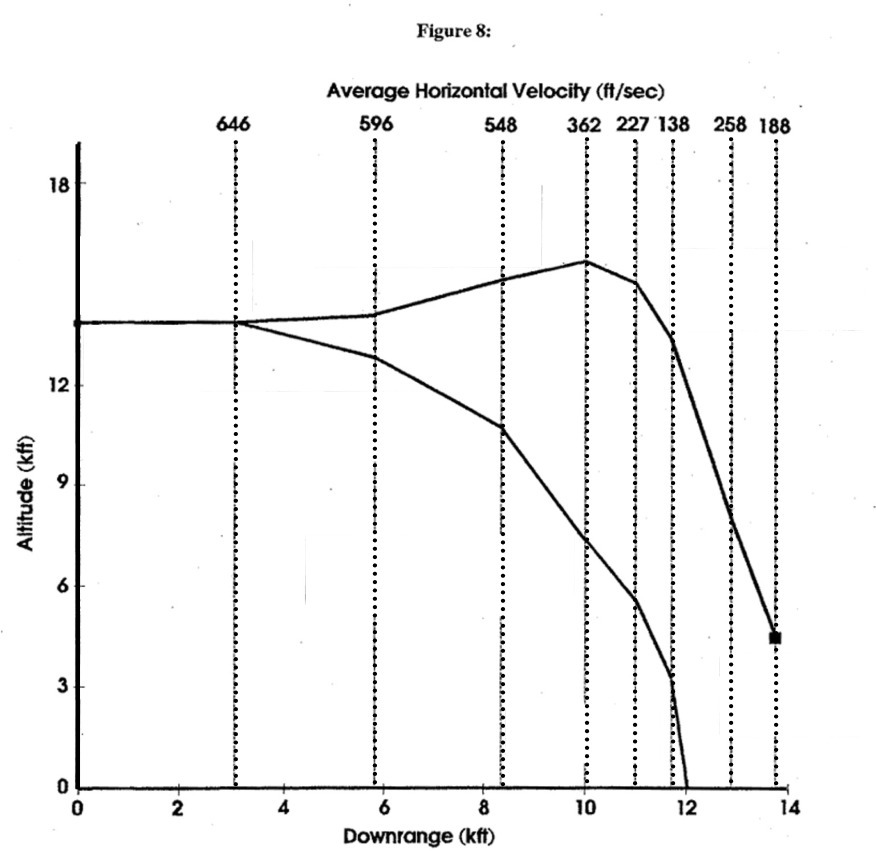
Trajectory Model essentially plots two scenarios, 1) a ballistic fall;
and 2) a zoom climb scenario. Figure 8 from that study: In the study, they make the case that the aircraft would not reach its known location in a ballistic fall because it would hit the water too soon. However, there are two serious flaws in this analysis. The above plot does not match the radar data they use in the study and it assumes an unreasonably high rate of fall. First, the rate of climb shown on the graphic does not match the data printed in the study. The graphic shows a slow rate of climb, yet the data they list shows a rate of climb of 396 ft/sec. Second, the radar has no altitude component, so the altitude must be estimated. They used the radar data to plot the distance traveled during each radar sweep, but the altitude has to be calculated. To calculate the altitude for the ballistic fall scenario, they plotted the horizontal distance traveled and assumed a rate of fall of over 624 ft/sec by the time the aircraft hit the water. In my plot, I used the same methodology and the same data from the JFK radar. I then assumed a rate of fall that increases with the acceleration of gravity V= 32 ft/sec2 . At some point a falling body reaches Terminal Velocity. There is no mention of Terminal Velocity in the Trajectory Study, but they used a figure of over 624 ft/sec. To put some perspective to Terminal Velocity, below is a list of terminal velocities of various bodies:
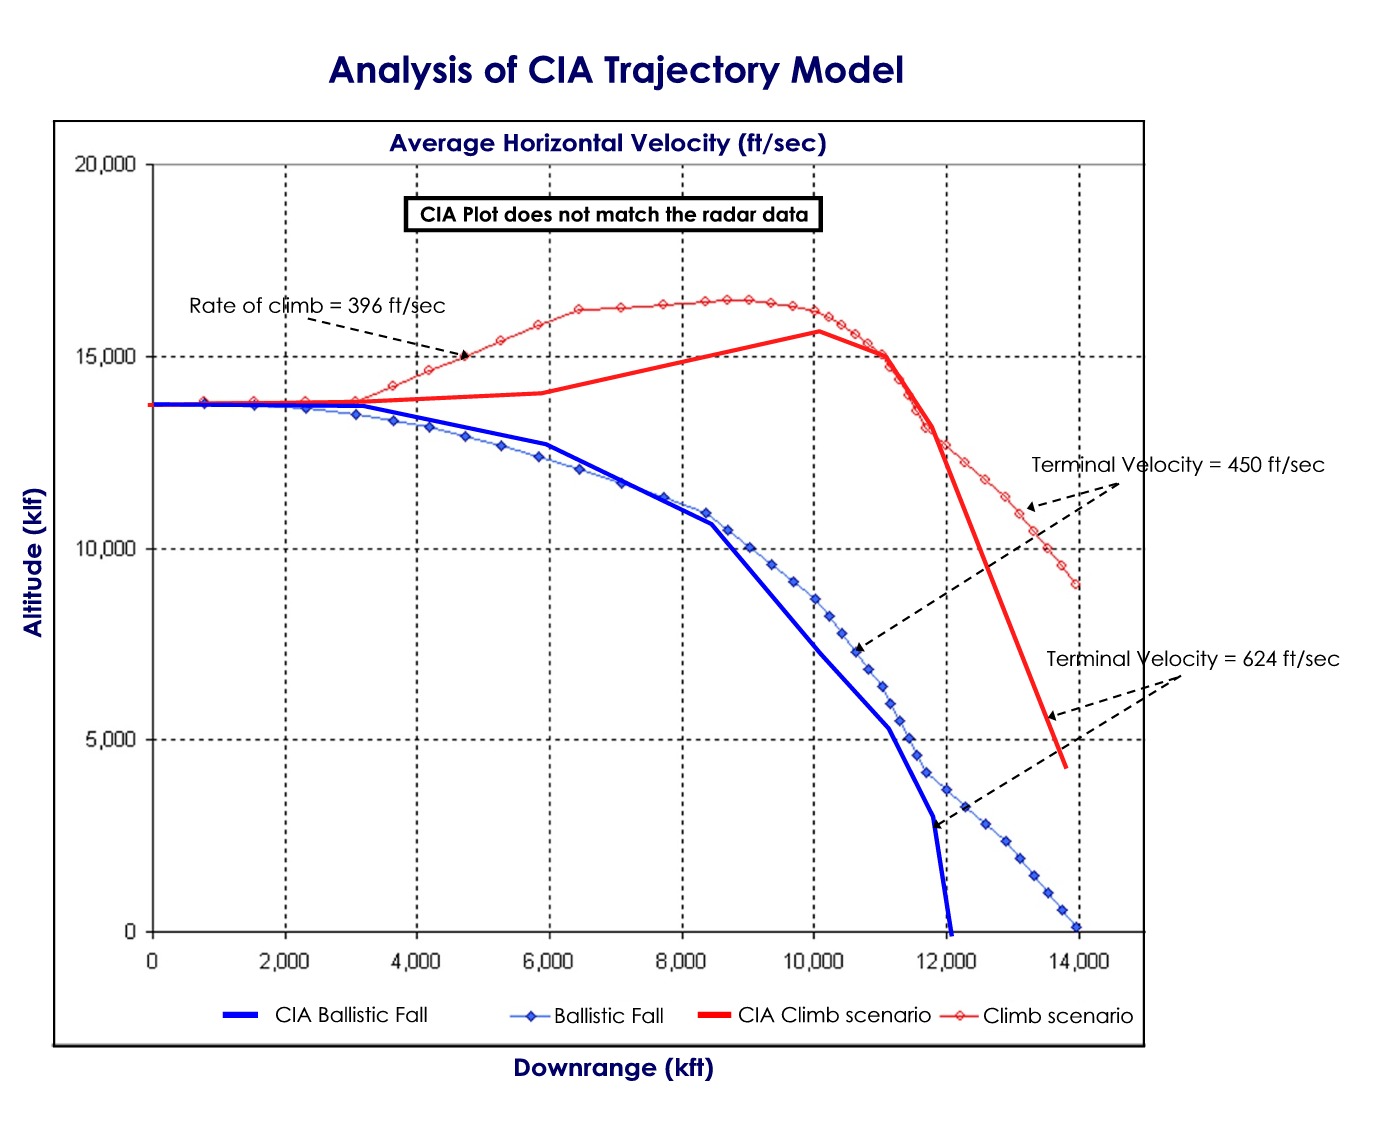
Terminal Velocity is affected by Mass (weight) and surface area. A bowling ball will fall faster than a box of the same weight. The drag of an object with a large surface area will slow the object down until the effect of gravity is in equilibrium with the resistance of the air pressure against the surface of the object. It is therefore more likely that a crippled 747 which is falling like a rock would fall at a rate of speed similar to an F14, or 450 ft/sec. In the table below I have overlaid a computer simulation of the rate of fall using all the same data, except I used a terminal velocity of 450 ft/sec.
You can see from the new plot that if you use 450 ft/sec as the terminal velocity, it will reach the location where it was recovered by the time of the last radar return. The radar distance they computed from the JFK radar shows the aircraft reaching 13,755 feet downrange, yet their graphic shows it hitting 2,000 feet short. It is obvious the graphic was drawn to fit the conclusion, not fit the data. You can also see from the zoom climb scenario that because it takes time to climb to 16,200 ft, it is still at nearly 9,000 ft. when the last radar return is received. What happened to the aircraft? If it continued on its present trajectory, it would likely land several thousand feet farther than where it was actually found. Even when using the unreasonable terminal velocity of 624 ft./sec, the aircraft is still at over 4,000 when it reaches the location where it was recovered in the debris field. My conclusion is that the Trajectory Study was done to support the Zoom Climb scenario and not to determine the truth. The Zoom Climb certainly cannot be supported by the data in the Trajectory Study. Bob Donaldson © 2001, 2002, 2003 & 2004, 2005 |